


If you're using Jest to test your code then you might want to include a report on what level of coverage you have on your code. In other words, how much of your application has been tested.
Let's say you have a simple project setup:
mkdir jest-test && cd jest-test
npm init -y
npm i -D jest
With a source file and a spec file:
touch app.js
touch app.spec.js
The contents of the app.js file isn't too important but it might have a simple function like this:
module.exports = aFunction = (a, b) => {
    const c = a + b;

    return c;
};
Your spec file would import that function and but perhaps you haven't written tests that fully cover the function's capabilities. In this case, I'll just put in a useless test that doesn't utilise the function at all.
const aFunction = require('./app');

describe('app', () => {
    it('should have a function', () => {
        expect(1).toBe(1);
    });
});
Now if we run Jest (either with just jest if you have it installed globally or add it to your package.json test script), everything passes:
> jest-test@1.0.0 test /Users/james/dev/jest-test
> jest

 PASS  ./app.spec.js
  app
    ✓ should have a function (3 ms)

Test Suites: 1 passed, 1 total
Tests:       1 passed, 1 total
Snapshots:   0 total
Time:        3.673 s
But we haven't written any tests for our function so how would we know that we've missed it out?
Let's add a config file and tell Jest to report to us what coverage we have with our tests.
touch jest.config.js
module.exports = {
    collectCoverage: true,
    coverageReporters: ['text'],
    coverageThreshold: {
        global: {
            branches: 95,
            functions: 95,
            lines: 95,
            statments: 95,
        },
    },
};
Now when we run the test suite again we see this:
----|---------|----------|---------|---------|-------------------
... | % Stmts | % Branch | % Funcs | % Lines | Uncovered Line #s
----|---------|----------|---------|---------|-------------------
... |   33.33 |      100 |       0 |   33.33 |
 ... |   33.33 |      100 |       0 |   33.33 | 2-4
----|---------|----------|---------|---------|-------------------
Jest: "global" coverage threshold for lines (95%) not met: 33.33%
Jest: "global" coverage threshold for functions (95%) not met: 0%
Also, Jest will fail with an appropriate exit status so any further commands you might be running (such as in a CI/CD pipeline) will not go ahead essentially stopping any further building of your project.
If you want something a bit more visual, you can add the lcov reporter to get a HTML output to examine in detail what code hasn't been covered.
Back in the jest.config, add the lcov reporter and specify a directory for the HTML to be generated in.
module.exports = {
    collectCoverage: true,
    coverageReporters: ['text', 'lcov'],
    coverageDirectory: './coverage',
    coverageThreshold: {
        global: {
            branches: 95,
            functions: 95,
            lines: 95,
            statments: 95,
        },
    },
};
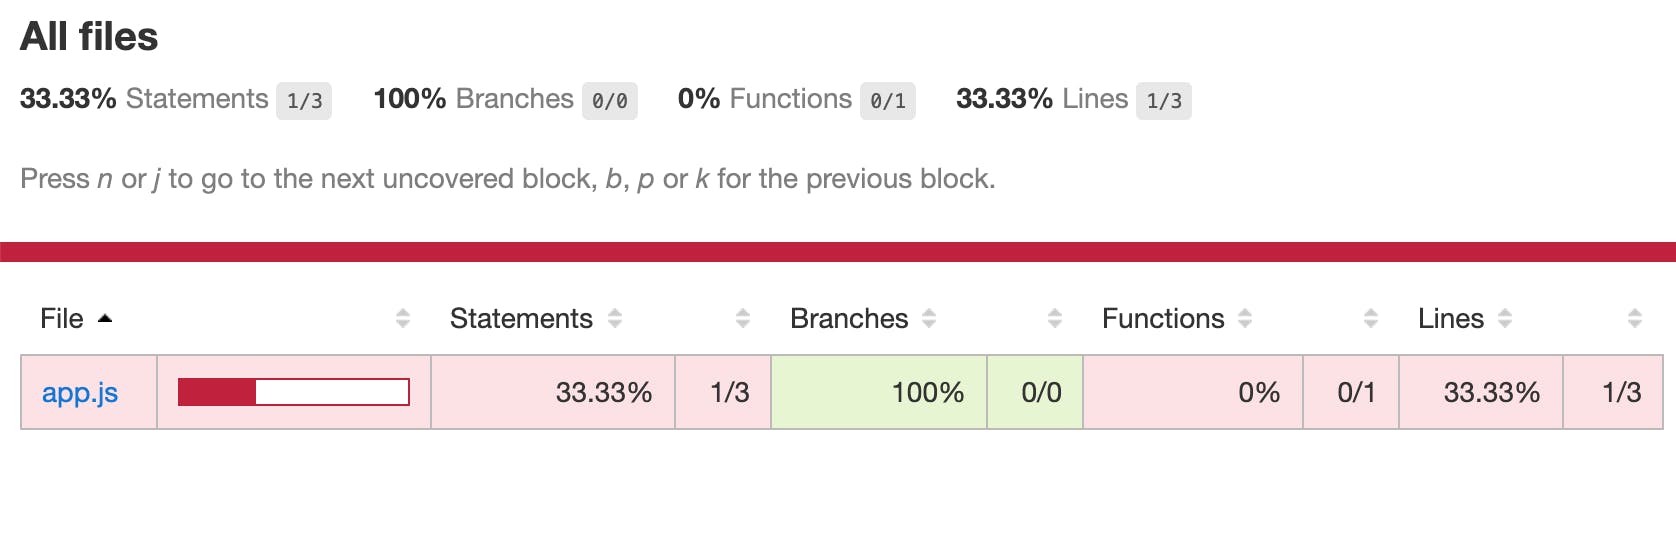
If you open the index.html file found in coverage/lcov-report you will see some details of the test suite that has just run:
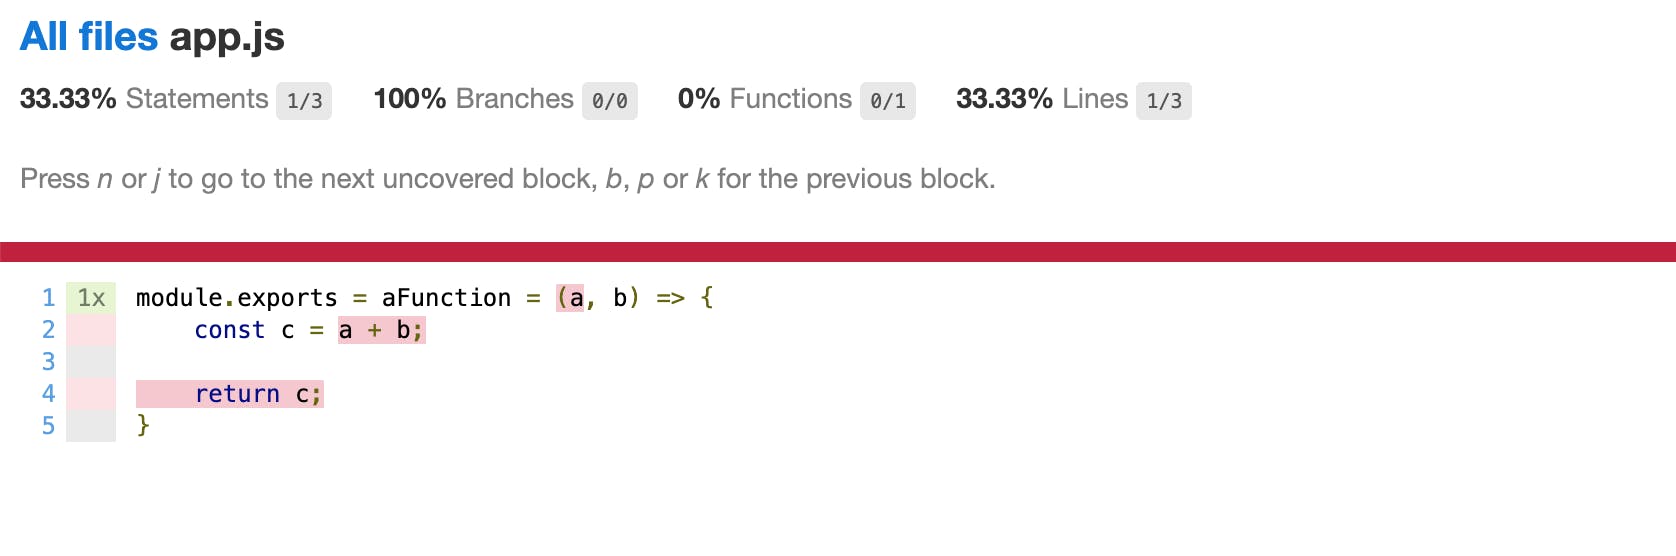
You can then drill down into the individual files that have been tested (just app.js in this case) and view in detail which lines have been covered (or not) with a test.
Good code coverage doesn't necessarily mean that your code is well tested, but it's definitely handy to see what lines of code you may not have considered within your existing set of tests.
Thanks for reading!
Follow me on Twitter @codebubb to keep in touch.